org mode plot data and save to file
Properly plot data in org mode with version <= 9.6. I was doing it manually by plotting it and screenshot the plot.
This saves a lot of time and streamlines my workflow.
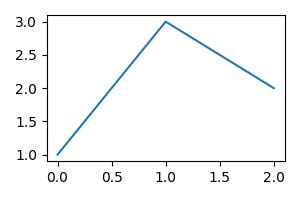
import matplotlib.pyplot as plt

fig=plt.figure(figsize=(3,2))
plt.plot([1,3,2])
fig.tight_layout()

fname = 'images/myfig.jpg'
plt.savefig(fname)
fname # return this to org-mode